What are spaghetti plots, and why are they used to forecast hurricanes?
The ‘spaghetti’ are individual computer model forecasts all placed on the same map to predict the movement of the center of a storm or hurricane.
What is a spaghetti plot?
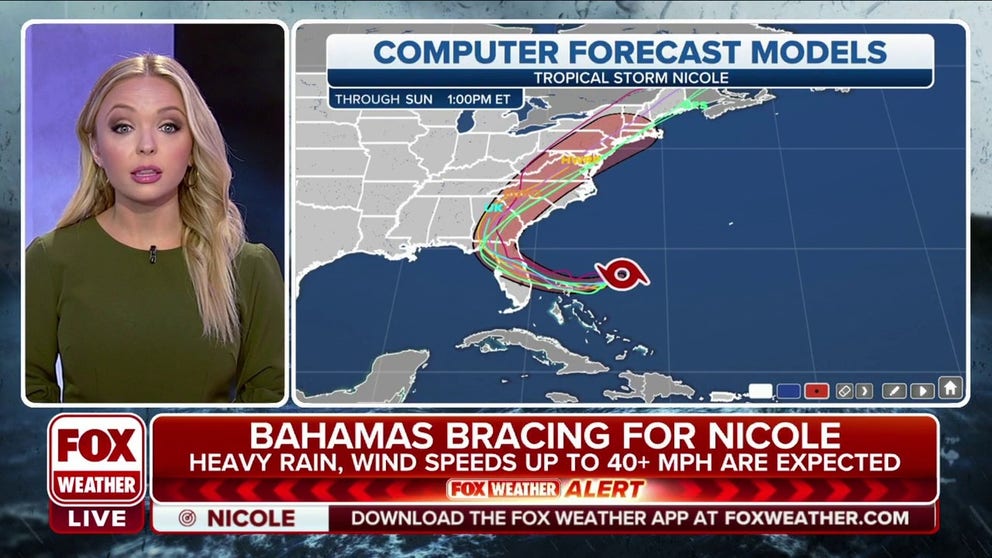
Meteorologist Kendall Smith uses spaghetti plots to show the potential paths of Nicole.
Spaghetti is not just a word used for dinner anymore, it's a technical term used to plot out forecasting models.
‘Hurricane spaghetti models’ or ‘spaghetti plots’ are used in the meteorological world to help predict where a hurricane will track.
It is easy to see how the spaghetti plot earned its name, as each model prediction looks like a strand of spaghetti plotted out on a map. Each strand in the spaghetti plot tracks every different computer model's prediction of where the storm's center will move in the future.
"Their main benefit to forecasters is that they show where the storm will be moving, how strong it will be and how confident the forecast is," explained FOX Weather Meteorologist and Senior Weather Producer Greg Diamond.
HERE ARE THE BUZZWORDS YOU'LL BE HEARING DURING HURRICANE SEASON
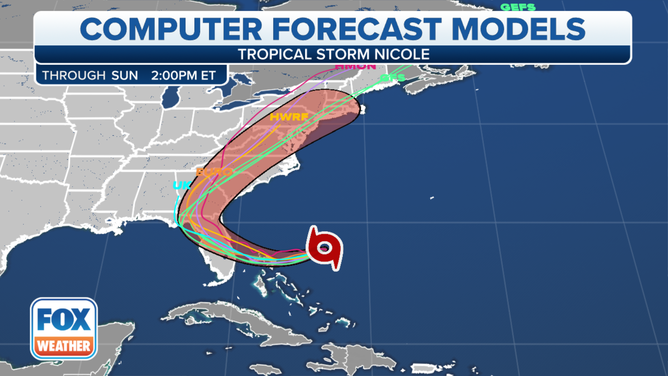
The spaghetti plot for Nicole with the cone of uncertainty overlaid in red.
(FOX Weather)
Spaghetti plots are a forecasting tool
Meteorologists lay each track on a single map, the ensemble, to see the consensus track. The consensus is the average of the separate plots.
In the video at the top of this story, Meteorologist Kendall Smith uses the plot to discuss Hurricane Nicole's predicted movement and explain the variability and uncertainty of its exact path.
"When the models are clustered close together, it indicates a higher than normal confidence in the track," said Diamond. "When there is a wide spread in the tracks, it makes the forecast more uncertain since there is a wider range of outcomes."
This is one of the tools that the National Hurricane Center meteorologists use to make the official forecast track. Looking at their official forecast, it is actually a cone that outlines the different paths of the different models.
WHAT IS THE ‘CONE OF UNCERTAINTY’ IN HURRICANE FORECASTS?
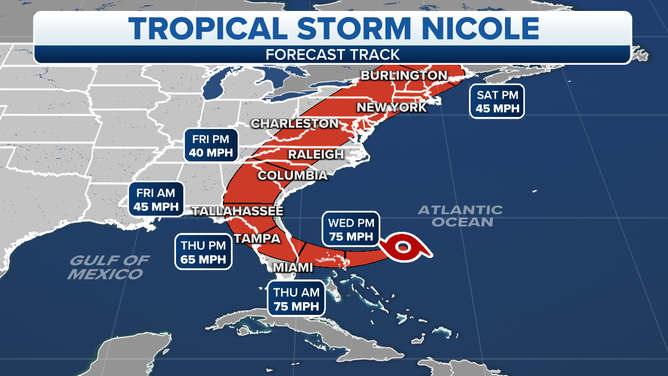
The cone of uncertainty shows the possible paths of Nicole, not just one line.
(FOX Weather)
Why are there so many models
SHIP (Statistical Hurricane Intensity Prediction Scheme), NVGM (Navy Global Environmental Model) and HWRF (Hurricane Weather Research and Forecast System) are just a few of the models that go into a spaghetti plot.
Each computer model is a different mathematical equation taking current statistics, data and laws of physics into account to predict what the atmosphere will look like in the future time.
"Models put out different solutions because they use different equations to simulate the future state of the atmosphere," Diamond said.
The different equations take different data into account and weight factors individually, for example, wind direction and strength at different levels of the atmosphere.
HERE IS WHY THE ATLANTIC HURRICANE SEASON RUNS FROM JUNE TO NOVEMBER
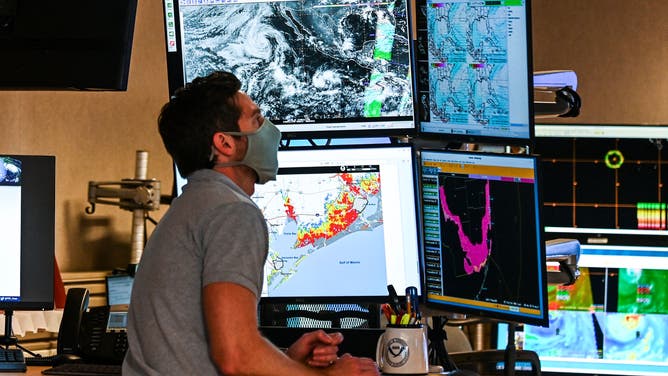
A meteorologist making a forecast at the National Hurricane Center.
(CHANDAN KHANNA/AFP / Getty Images)
That is why each model performs better or more accurately with certain atmospheric conditions. So, one model may be better at predicting the interaction of a tropical depression with a cold front, while another will be better at predicting a strengthening tropical storm in lower latitudes in the spring.
The more factors in the equation, the longer computers will take to solve it and plot points. Some are so complex, machines take hours to compute on a series of supercomputers. Meteorologists have to weigh the timeliness of the solution versus the amount of information they can include in the model and complexity to get the most accurate result in a reasonable amount of time.
Two main categories of weather models
Most of the models fall into two categories: dynamic and statistical.
"Dynamical models solve equations that describe how wind, temperature, and moisture evolve within the atmosphere," Diamond said. "Most of these models forecast the weather over the entire globe, not just around the tropical system."
Dynamic, also known as numerical models, are the most complex as they require high-speed computing.
NOAA uses spaghetti plots to forecast weather around the world.
(NOAA)
"Statistical models are less complex and use statistics that describe how a tropical system moves and/or changes in intensity in response to climatology and/or weather conditions near the storm," Diamond continued. "Statistical models are often more useful for intensity forecasts than dynamical models."
Statistical models also require less computer power.
The FOX Weather app is a great resource that can be used to alert you of any watches or warnings issued for your area. The free FOX Weather livestream is also available 24/7 on the website and app and on your favorite streaming platform. The FOX Weather Update podcast also provides weather information for the entire country.