'Zoomies' could lead to better understanding of hurricane forecasts, study finds
These moving dots can help people better assess risks from hurricanes, researcher says
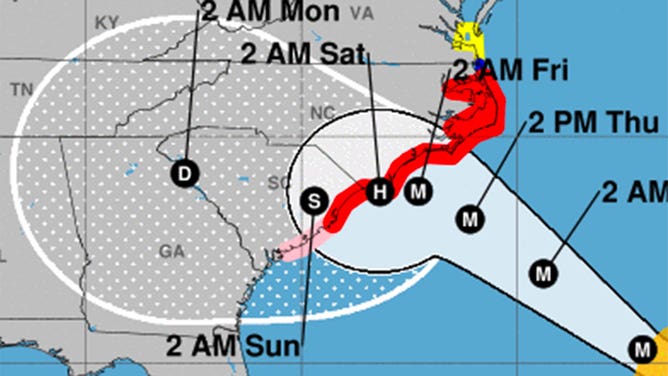
The cone of uncertainty for Hurricane Florence in 2018 is seen in this graphic.
(NHC)
During hurricane season, people who live along the Gulf of Mexico or the Atlantic coast of the U.S. wait to see if one of Earth’s most powerful storms will head their way.
The National Hurricane Center is responsible for issuing forecasts for any tropical systems that may threaten the coastline of the U.S., and part of that forecast is the ominously named "cone of uncertainty." Basically, it’s the margin of error for the NHC’s forecast of where the center of a storm is headed.
Jessica Witt, a psychology professor at Colorado State University, is a vision scientist who studies how a person sees and processes information. She is part of a research team studying how the general public interprets the NHC’s "cone of uncertainty."
Forecasters make it clear that effects from a landfalling storm, such as heavy rain, storm surge and wind, can be felt far away from the center, but people sometimes mistakenly believe they are safe from the bad weather because they aren’t in that "cone," according to Jessica Witt, a professor of psychology at Colorado State University.
"It's one of the products that is most familiar to the public, and the problem is that it's misunderstood," Witt said.
The problem
Witt said people are good at understanding that the NHC’s "cone" forecast is communicating risk, but the level of risk is being misinterpreted. She said it all has to do with how the brain interprets boundaries.
"When you've got these strict boundaries like the 'cone of uncertainty has, that's a signal to the visual system that there is a delineation here that's really important," Witt said. "There's kind of an in and out. There's this-versus-that, and the brain loves that kind of categorization. That makes sense to the brain."
Witt said people prefer to have a binary choice. As anyone knows, forecasting the weather is anything but a black-and-white decision. It’s often an interpretation of several different data sets aimed at making the most accurate prediction, which can lead to a lot of gray areas.
‘Zoomies’ could be the solution
According to Witt, her team wanted to capitalize on one of the most fundamental functions of a person’s visual system — the ability to quickly assess a grouping of objects — and see if that ability can be applied to a better understanding of hurricane forecasts.
The team developed a new way of displaying the forecast called "zoomies." It uses a group of dots to indicate the likely movement of a storm. Think of them as a new take on the "spaghetti plots" people love so much during hurricane season — an ensemble, or grouping, of data sets displayed in a single image.
"It turns out, our visual system is exceptional at perceiving the properties of groups," Witt said. "So you can imagine looking at the leaves on a tree and your visual system, can, what we call, extract information about this group. So we can see the average color, the average size, the average shape of these leaves."
In addition to being displayed as a group, the dots move along the projected path of the storm. She said the dynamic display coupled with the grouping of dots can help give a person a better sense of where a storm might be headed.
"So we're leveraging the visual system's ability to automatically, quickly and accurately extract these properties in a really intuitive way," Witt said. "These things move like hurricanes. It's obvious what they're showing."
Studying 2 groups
Witt’s team conducted a study using two groups of people — some from Colorado, who have little experience with hurricanes, and some from Florida, who have lots of experience with hurricanes. The groups were asked to decide who should be evacuated from an incoming storm based on two different types of forecasts. The first was the usual NHC "cone of uncertainty" forecast, and the other was a forecast developed by Witt’s team called "zoomies."
"We ran the identical study using these two populations -- the Colorado group and a Florida group — and the results were almost identical.
According to Witt, people who evaluated the "cone of uncertainty" assessed the highest risk to people within the cone, while the same people assessed risk to a much larger area outside of the "cone" when using the "zoomies" forecast.
Witt said that with the group of Floridians, who have dealt with hurricanes at a much higher rate than their Colorado counterparts, had an even stronger containment effect that was produced by the cone-based forecast.
"What you know about hurricanes just cannot override this visual signal," Witt said. "We see this all the time in vision. In fact, that's one of the traits of the visual system. It's called cognitive impenetrability."
Future forecasts
Witt said the ultimate goal is to get the information about hurricane forecasts to the public in a way that is easier to understand. Another goal is fostering the public’s confidence in a forecast, a subject she is also interested in studying.
"If the cone shows that your area is not at risk and then suddenly you're at risk, or vice versa, the public loses trust," Witt said. "Even though the model is correct, and even though the 'cone' truthfully illustrated the model, the public didn't understand it. So then they lose trust."
According to Witt, there are lots of variations of "zoomies" that seemed to work the same way, including overlaying the dot-plots on top of the existing cone-based forecast. She said increasing the size of a dot or changing its color based on risk can also aid a person’s visual system in interpreting the data in an accurate way.
"People struggle to understand uncertainty and so they don't necessarily make the right decisions, because if they don't understand the information, it's hard to make that decision," Witt said.