The US Drought Monitor explained
Four classifications of severity are used to show areas of drought across the United States

A FILE photo shows cracked brown soil during a drought.
(Photo by redcharlie on Unsplash)
The U.S. Drought Monitor is a weekly map released on Thursdays that shows which areas of America are currently in drought using four classifications of severity.
It is jointly produced by the National Drought Mitigation Center at the University of Nebraska-Lincoln, the United States Department of Agriculture and NOAA.
The data used in the U.S. Drought Monitor are cut off at 8 a.m. Eastern daylight time every Tuesday. The maps, which are based on an analysis of that data, are then released at 8:30 a.m. Eastern time each Thursday.
An example of the U.S. Drought Monitor is shown below.
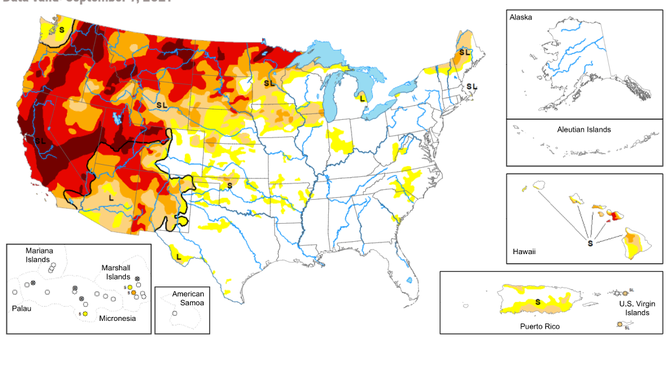
Shown above is an example of the U.S. Drought Monitor released Sept. 9, 2021.
(National Drought Mitigation Center, USDA and NOAA)
The map identifies areas of drought and labels them using four classifications of severity. D1 is the least intense level of drought while D4 the most intense. Drought is defined as a soil-moisture deficit significant enough to have social, environmental or economic effects.
D0 areas on the map are not in drought, but they are either experiencing abnormally dry conditions that could turn into drought or are recovering from drought but not yet back to normal.
Areas in D1, or moderate drought, can have some damage to crops or pastures, along with low water levels in creeks and streams and developing or imminent water shortages.
Level D2, or severe drought, typically results in crop or pasture losses and water shortages that may lead to water restrictions.
Once a drought worsens to the level of D3, or extreme drought, there will be major crop or pasture losses and widespread water shortages or restrictions.
D4, or exceptional drought, is the most intense level of drought, which indicates exceptional and widespread crop or pasture losses, as well as water shortages in creeks and streams to the point of creating water emergencies.
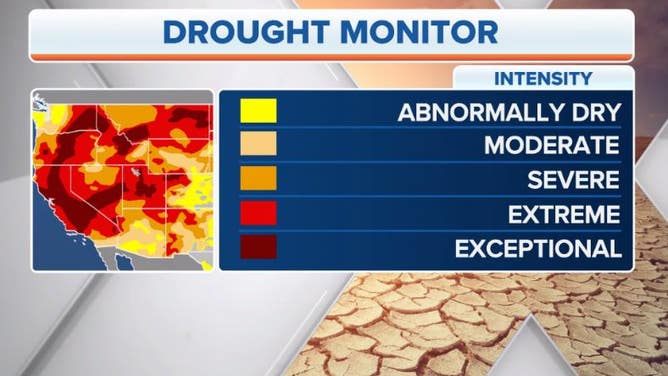
NOT THE CURRENT U.S. DROUGHT MONITOR – Various colors are used to indicate the different intensities of drought on the U.S. Drought Monitor.
(FOX Weather)
More than 450 expert observers around the United States provide reports of local conditions and impacts in their areas. These reports are used to assist the NDMC, USDA and NOAA with the creation of the drought maps each week.
The U.S. Drought Monitor also denotes whether the primary physical effects are for short- or long-term drought, denoted on the map by "S," "L" or "SL."
An "S" indicates short-term drought impacts, typically less than six months, affecting agriculture and grasslands. An "L" means there are long-term drought impacts, ongoing for six months or more, affecting hydrology (water) and ecology (living organisms and their physical environment). An area labeled with "SL" contains both short- and long-term drought impacts.
"Drought is a slow-moving hazard, so you can be certain that an area will still be in drought if it doesn’t get rain," the NDMC noted on its website. "But it also may take more than one good rainfall to end a drought, especially if an area has been in drought for a long time."
It’s important to understand that the U.S. Drought Monitor is not a forecast. Instead, it’s a weekly assessment of drought conditions based on how much precipitation has fallen (or not fallen) over the previous seven days ending at 8 a.m. Eastern daylight time on Tuesday. That gives the analysts two days to produce the map before it’s released Thursday morning.
Since the data cutoff time is Tuesday morning, any heavy rain that falls over a drought area on a Wednesday would not be factored into the U.S. Drought Monitor until the following week’s update.